Hardware breakpoints are mainly used for debugging purposes. Unlike regular breakpoints, they do not require any code modification and are more versatile. Because of this, they are often used when debugging targets that utilise anti-debug tactics. This article will detail the inner workings of hardware breakpoints on Windows and go over some common uses and detection methods.
0.0 Preface
The research in this blog has been conducted on 64-bit Windows 10 20H1. It is possible that certain techniques might be similar on 32-bit Windows, however this is not the focus of this blog post. Moreover, these techniques will likely differ a lot on other operating systems such Linux and OSX because of architectural differences.
1.0 Quick primer on debug registers
Readers who are familiar with debug registers can skip ahead to 2.0.
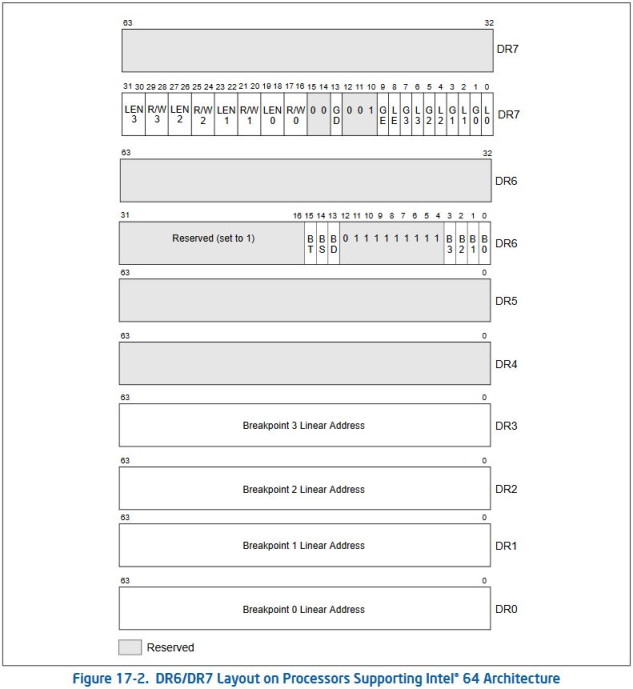
Hardware breakpoints are available on both x86 and x64. They are implemented with the help of 8 debug registers, named DR0 through DR7. These registers are 32- and 64 bits long on x86 and x64 respectively. The layout of the registers on an x64 architecture can seen on the figure below. Don’t worry if the layout seems confusing, we will go over each register in more detail. If you want to learn more about the finer details of debug registers, the Intel SDM and AMD APM are great resources.
1.1 DR0 - DR3
DR0 through DR3 are referred to as “Debug Address Registers” or “Address-Breakpoint Registers”. They are very simple as they just contain the linear address of the breakpoint. When this address matches an instruction or data reference, a breakpoint will be occur. Debug register DR7 can be used to have more fine-grained control over the conditions of each breakpoint. Because the registers need to be filled with a linear address, they will work even if paging is turned off. In this case, the linear address will be the same as the physical address.
Because there are only 4 of these registers available, it is only possible to have a maximum of 4 breakpoints simultaneously per thread.
1.2 DR4 - DR5
DR4 and DR5 and referred to as “Reserved Debug Registers”. Despite what their name might suggest, they are not always reserved and can still be used. Their functionality depends on the value of the DE field in control register CR4. When this bit is enabled, I/O breakpoints are enabled and attempting to access one of the registers results in an #UD exception being generated. However, when the DE bit is not enabled, the debug registers DR4 and DR5 are mapped to DR6 and DR7 respectively. This is done for compatibility with software for older processors.
1.3 DR6
When a hardware breakpoint is triggered, the debug status is stored in debug register DR6. That is why this register is referred to as the “Debug Status Register”. It contains bits to quickly check if certain events got triggered.
Bits 0 through 3 are set based on which hardware breakpoint is triggered. This is used to quickly check which breakpoint is triggered.
Bit 13 is called BD and is set if the current exception is triggered because of access to a debug register. The GD bit must be enabled in DR7 for this type of exception to be triggered.
Bit 14 is called BS and is set if the current exception is triggered because of single step. The TF flag must be enabled in the EFLAGS register for this type of exception to be triggered.
Bit 15 is called TS and is set if the current exception is triggered because the current task switched to a task which has the debug trap flag enabled.
1.4 DR7
DR7 is referred to as the “Debug Control Register” and allows fine-grained control of each hardware breakpoint. The first 8 bits control if a specific hardware breakpoint is enabled. Even bits (0, 2, 4 and 6), called L0 - L3, enable the breakpoint locally, meaning it will only trigger when the breakpoint exception is detected in the current task. The uneven bits (1, 3, 5, 7), called G0 - G3, enable the breakpoint globally, meaning it will trigger when the breakpoint exception is detected in any task. When a breakpoint is enabled locally, the corresponding bits gets removed when a hardware task switch occurs to avoid unwanted breakpoints in the new task. The bits do not get cleared when it is enabled globally.
Bits 8 and 9 are called LE and GE, and are legacy features which will not do anything on modern processors. These bits were used to instruct the processor to detect the exact instruction the breakpoint occurred on. All breakpoint conditions on modern processors are exact. For compatibility with older hardware, it is recommend to always set both bits to 1.
Bit 13 is called GD and is very interesting. If this bit is enabled, a debug exception will be generated whenever an instruction tries to access a debug register. To distinguish this type of exception from a normal hardware breakpoint exception, the BD flag is enabled in the debug register DR6. This bit is commonly used to stop programs from interfering with the debug registers. It is important to keep in mind that the exception happens before the instruction is executed and this flag is automatically removed by the processor when the debug exception handler is entered. However, this solution is not perfect as it only works using the MOV instructions to access a debug register. These are inaccessible in user-mode and from my testing, the GetThreadContext and SetThreadContext functions do not trigger this event. This makes this detection unable to be used in user-mode.
Bits 16 through 31 are used to control the conditions and size of each hardware breakpoint. Each register has 4 bits, which are divided into 2 2-bit fields. The first 2 bits are used to conditions the type of the hardware breakpoint. It is possible to only generate a debug exception on instruction execution, data write, I/O read and write, data read and write. I/O read and write is only enabled if the DE field in control register CR4 is enabled, otherwise this condition is undefined behaviour. The size can be controlled using the last 2 bits and is used to specify the size of the memory location at the specified address. The available sizes are 1 byte, 2 bytes, 4 bytes and 8 bytes1.
1.5 Usage
Usage of the debug registers is fairly straightforward. Special instructions exist to move the contents from a general-purpose register to a debug register or vice-versa2. However, these instructions can only be executed at privilege level 0 otherwise a #GP(0) exception will be generated. To allow user-mode applications to change a debug register, Windows added support for changed these registers using the SetThreadContext and GetThreadContext API. Example usage of these functions is demonstrated in the following snippet.
1
2
3
4
5
6
7
8
9
10
11
12
13
14
/* Initialize context structure */
CONTEXT context = { 0 };
context.ContextFlags = CONTEXT_ALL;

/* Fill context structure with current thread context */
GetThreadContext(GetCurrentThread(), &context);

/* Set a local 1-byte execution hardware breakpoint on 'test_func' */
context.Dr0 = (DWORD64)&test_func;
context.Dr7 = 1 << 0;
context.ContextFlags = CONTEXT_DEBUG_REGISTERS;

/* Set the context */
SetThreadContext(GetCurrentThread(), &context);
2.0 Windows and exceptions
Now that we know how we can use hardware breakpoints, it’s time to look how Windows deals with them.
When a hardware breakpoint is triggered, no matter the reason, a #DB exception is triggered. This corresponds to interrupt #1, which means that execution will be redirected to interrupt handler 1. For more information about how exceptions are handled, I recommend reading this blog post written by Daax.
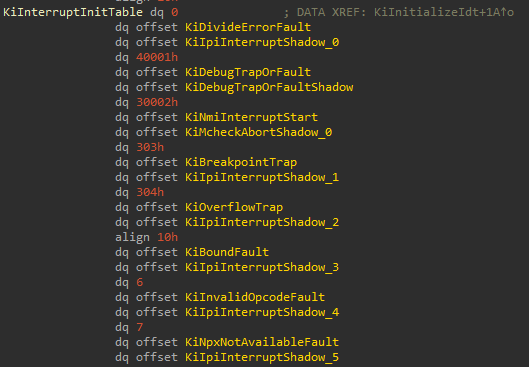
In Windows, each interrupt handler is initialized during boot time. How exactly this is done is not important for now. Each interrupt handler can be found in a table called KiInterruptInitTable in ntoskrnl.exe. This shows us that KiDebugTrapOrFault is the interrupt handler for interrupt #1. The second function of each entry can be ignored for now, it has to do with the Meltdown mitigation that was added to Windows.3
KiDebugTrapOrFault starts off by doing some sanity checks to ensure GS is correct. These checks were added to mitigate CVE-2018-88974. If everything is correct, KxDebugTrapOrFault is called. This function is equivalent to KiDebugTrapOrFault before the mitigation was added. The function starts off by saving certain registers into a TrapFrame. The rest of the function isn’t very useful for us, but it checks some things such as SMAP. At the end of the function, KiExceptionDispatch is called.
KiExceptionDispatch is a bit interesting than the previous functions. It starts off by allocating an ExceptionFrame on the stack and filling it. After this it saves some non-volatile registers. Once this is done, the function will make an ExceptionRecord and fill this with info about the current exception. Afterwards, KiDispatchException is called.
1
2
3
4
5
6
7
8
9
10
11
12
13
14
15
16
17
18
19
20
21
22
23
24
25
26
27
28
29
30
31
32
33
34
35
36
37
38
39
40
41
42
43
44
45
46
47
48
.text:00000001403EF940     KiExceptionDispatch proc near
.text:00000001403EF940
.text:00000001403EF940     ExceptionFrame  = _KEXCEPTION_FRAME ptr -1D8h
.text:00000001403EF940     ExceptionRecord = _EXCEPTION_RECORD ptr -98h
.text:00000001403EF940
.text:00000001403EF940                 sub     rsp, 1D8h
.text:00000001403EF947                 lea     rax, [rsp+1D8h+ExceptionFrame._Rbx]
.text:00000001403EF94F                 movaps  xmmword ptr [rsp+1D8h+ExceptionFrame._Xmm6.Low], xmm6
.text:00000001403EF954                 movaps  xmmword ptr [rsp+1D8h+ExceptionFrame._Xmm7.Low], xmm7
.text:00000001403EF959                 movaps  xmmword ptr [rsp+1D8h+ExceptionFrame._Xmm8.Low], xmm8
.text:00000001403EF95F                 movaps  xmmword ptr [rsp+1D8h+ExceptionFrame._Xmm9.Low], xmm9
.text:00000001403EF965                 movaps  xmmword ptr [rsp+1D8h+ExceptionFrame._Xmm10.Low], xmm10
.text:00000001403EF96B                 movaps  xmmword ptr [rax-80h], xmm11
.text:00000001403EF970                 movaps  xmmword ptr [rax-70h], xmm12
.text:00000001403EF975                 movaps  xmmword ptr [rax-60h], xmm13
.text:00000001403EF97A                 movaps  xmmword ptr [rax-50h], xmm14
.text:00000001403EF97F                 movaps  xmmword ptr [rax-40h], xmm15
.text:00000001403EF984                 mov     [rax], rbx
.text:00000001403EF987                 mov     [rax+8], rdi
.text:00000001403EF98B                 mov     [rax+10h], rsi
.text:00000001403EF98F                 mov     [rax+18h], r12
.text:00000001403EF993                 mov     [rax+20h], r13
.text:00000001403EF997                 mov     [rax+28h], r14
.text:00000001403EF99B                 mov     [rax+30h], r15

[...]

.text:00000001403EF9BD                 lea     rax, [rsp+1D8h+ExceptionFrame.Return]
.text:00000001403EF9C5                 mov     [rax], ecx
.text:00000001403EF9C7                 xor     ecx, ecx
.text:00000001403EF9C9                 mov     [rax+4], ecx
.text:00000001403EF9CC                 mov     [rax+8], rcx
.text:00000001403EF9D0                 mov     [rax+10h], r8
.text:00000001403EF9D4                 mov     [rax+18h], edx
.text:00000001403EF9D7                 mov     [rax+20h], r9
.text:00000001403EF9DB                 mov     [rax+28h], r10
.text:00000001403EF9DF                 mov     [rax+30h], r11
.text:00000001403EF9E3                 mov     r9b, [rbp+0F0h]
.text:00000001403EF9EA                 and     r9b, 1          ; PreviousMode
.text:00000001403EF9EE                 mov     byte ptr [rsp+1D8h+ExceptionFrame.P5], 1 ; FirstChance
.text:00000001403EF9F3                 lea     r8, [rbp-80h]   ; TrapFrame
.text:00000001403EF9F7                 mov     rdx, rsp        ; ExceptionFrame
.text:00000001403EF9FA                 mov     rcx, rax        ; ExceptionRecord

[...]

.text:00000001403EFA67 SkipExceptionStack:
.text:00000001403EFA67                 call    KiDispatchException
KiDispatchException is a fairly long function where the exception is finally dispatched to the exception handler. Well, almost. In short, this function will apply some transforms to the exception code, combine the TrapFrame and ExceptionFrame into a ContextRecord and preprocess the exception by calling KiPreprocessFault. What happens from here depends on if the exception came from user-mode or kernel-mode. In both cases it will allow a debugger to handle it as a first and second chance.
If the exception came from kernel-mode, RtlDispatchException will be called that will search for any SEH handlers and call those. If it cannot find an SEH handler or if the exception is not handled correctly, the system will bugcheck by calling KeBugCheckEx. If the exception came from user-mode, certain fields in the TrapFrame will be corrected such as the stack pointer. Finally, the instruction pointer in the TrapFrame will be overwritten with the address of KeUserExceptionDispatcher. We’ll get to what this function does in a bit. The ExceptionRecord and ContextRecord are copied to the user stack and the function will return.
Once back in KiExceptionDispatch, we will simply clean up the stack, restore the volatile state we saved earlier and return to user-mode with the help of iretq. Because we overwrote the user stack earlier, execution flow is resumed from KeUserExceptionDispatcher.
1
2
3
4
5
6
7
8
9
10
11
12
13
14
15
16
17
18
19
20
21
22
23
24
25
26
27
28
29
30
31
32
.text:00000001403EFA6C                 lea     rcx, [rsp+1D8h+ExceptionFrame._Rbx] ; rcx = _KTRAP_FRAME
.text:00000001403EFA74                 movaps  xmm6, xmmword ptr [rsp+1D8h+ExceptionFrame._Xmm6.Low]
.text:00000001403EFA79                 movaps  xmm7, xmmword ptr [rsp+1D8h+ExceptionFrame._Xmm7.Low]
.text:00000001403EFA7E                 movaps  xmm8, xmmword ptr [rsp+1D8h+ExceptionFrame._Xmm8.Low]
.text:00000001403EFA84                 movaps  xmm9, xmmword ptr [rsp+1D8h+ExceptionFrame._Xmm9.Low]
.text:00000001403EFA8A                 movaps  xmm10, xmmword ptr [rsp+1D8h+ExceptionFrame._Xmm10.Low]
.text:00000001403EFA90                 movaps  xmm11, xmmword ptr [rcx-80h]
.text:00000001403EFA95                 movaps  xmm12, xmmword ptr [rcx-70h]
.text:00000001403EFA9A                 movaps  xmm13, xmmword ptr [rcx-60h]
.text:00000001403EFA9F                 movaps  xmm14, xmmword ptr [rcx-50h]
.text:00000001403EFAA4                 movaps  xmm15, xmmword ptr [rcx-40h]
.text:00000001403EFAA9                 mov     rbx, [rcx]
.text:00000001403EFAAC                 mov     rdi, [rcx+8]
.text:00000001403EFAB0                 mov     rsi, [rcx+10h]
.text:00000001403EFAB4                 mov     r12, [rcx+18h]
.text:00000001403EFAB8                 mov     r13, [rcx+20h]
.text:00000001403EFABC                 mov     r14, [rcx+28h]
.text:00000001403EFAC0                 mov     r15, [rcx+30h]

[...]

.text:00000001403EFBEC                 mov     rdx, [rbp-40h]
.text:00000001403EFBF0                 mov     rcx, [rbp-48h]
.text:00000001403EFBF4                 mov     rax, [rbp-50h]
.text:00000001403EFBF8                 mov     rsp, rbp
.text:00000001403EFBFB                 mov     rbp, [rbp+0D8h]
.text:00000001403EFC02                 add     rsp, 0E8h

[...]

.text:00000001403EFC17                 swapgs
.text:00000001403EFC1A                 iretq
Remember that KeUserExceptionDispatcher address we set earlier? This is actually KiUserExceptionDispatcher which is located in ntdll.dll. This function is responsible for the user-mode part of handling exceptions. It will get the ExceptionRecord and Context from the exception and pass execution to RtlDispatchException. I’m not going into much detail here but eventually it will check for SEH and VEH exception handlers and call them if present.
1
2
3
4
5
6
7
8
9
10
11
12
13
14
15
16
17
18
19
20
21
22
23
24
25
26
27
28
29
30
31
32
33
34
.text:000000018009EBF0 KiUserExceptionDispatcher proc near
.text:000000018009EBF0                 cld
.text:000000018009EBF1                 mov     rax, cs:Wow64PrepareForException
.text:000000018009EBF8                 test    rax, rax
.text:000000018009EBFB                 jz      short loc_18009EC0C
.text:000000018009EBFD                 mov     rcx, rsp
.text:000000018009EC00                 add     rcx, 4F0h
.text:000000018009EC07                 mov     rdx, rsp
.text:000000018009EC0A                 call    rax ; Wow64PrepareForException
.text:000000018009EC0C
.text:000000018009EC0C loc_18009EC0C:
.text:000000018009EC0C                 mov     rcx, rsp
.text:000000018009EC0F                 add     rcx, 4F0h
.text:000000018009EC16                 mov     rdx, rsp
.text:000000018009EC19                 call    RtlDispatchException
.text:000000018009EC1E                 test    al, al
.text:000000018009EC20                 jz      short loc_18009EC2E
.text:000000018009EC22                 mov     rcx, rsp
.text:000000018009EC25                 xor     edx, edx
.text:000000018009EC27                 call    RtlGuardRestoreContext
.text:000000018009EC2C                 jmp     short loc_18009EC43
.text:000000018009EC2E ; ---------------------------------------------------------------------------
.text:000000018009EC2E
.text:000000018009EC2E loc_18009EC2E:
.text:000000018009EC2E                 mov     rcx, rsp
.text:000000018009EC31                 add     rcx, 4F0h
.text:000000018009EC38                 mov     rdx, rsp
.text:000000018009EC3B                 xor     r8b, r8b
.text:000000018009EC3E                 call    ZwRaiseException
.text:000000018009EC43
.text:000000018009EC43 loc_18009EC43:
.text:000000018009EC43                 mov     ecx, eax
.text:000000018009EC45                 call    RtlRaiseStatus
.text:000000018009EC45 KiUserExceptionDispatcher endp
3.0 (Malicious) Uses
3.1 Debugging
As mentioned in their name, debug registers are primarily used for debugging purposes. While regular breakpoints require editing the assembly to add a breakpoint instruction, hardware breakpoints are able to be used without modifying any assembly. This is especially useful when dealing with self-modifying code or integrity checks.
3.2 Malware
Because of their discreet usage and built-in security controls (See DR7, bit 13), they are also a favourite tool of malware authors, especially rootkits. They allow the malware to silently hook a function. This can be used to hook important system routines, such as KiSystemCall64 on Windows or do_debug on Linux5.
3.3 Cheating
Of course, these techniques are also utilized by cheats that want to remain hidden from anti-cheats. The debug registers can be used to hook important game functions and implement custom logic. A good example of this is the Outlines VEH hook released by EBFE for Overwatch. A debug register is placed on the function responsible for drawing player outlines and an exception handler is registered using AddVectoredExceptionHandler. When the outlines function gets called by the game, the hardware breakpoint will fire and redirect control flow to the registered exception handler. In here, it checks if the exception came from the outlines function and edit some data to make the game draw the outline for all players. It appears this technique is quite good as Blizzard seems to have trouble detecting it.
4.0 Common detection vectors
In the final section, we will go over some common detection vectors for hardware breakpoints. For the sake of simplicity, no obfuscation techniques will be applied to the examples and this is left as an exercise for the reader. You can go as wild as you want.
4.1 GetThreadContext
One of the simplest ways to detect hardware breakpoints is by using the GetThreadContext WinAPI. This function will simply returns a CONTEXT structure for a given thread. This structure includes the value of each debug register which allows us to easily check if any of the registers are filled.
This detection is very easy to implement, but is also easy to bypass. For example, an attacker can simply hook GetThreadContext to return a fake structure with stripped debug register fields.
1
2
3
4
5
6
7
8
9
10
11
12
13
14
15
16
17
18
/* Prepare the context structure */
CONTEXT context = { 0 };
/* CONTEXT_ALL will fill all the fields in the structure, this can be changed depending on your needs. */
context.ContextFlags = CONTEXT_ALL;

/* Call GetThreadContext with the current thread */
BOOL result = GetThreadContext(GetCurrentThread(), &context);
if (!result)
{
	/* GetThreadContext failed, use GetLastError to find out why */
	return;
}

/* Check each debug register field */
if (context.Dr0 != 0 /* ... */)
{
	/* Debug register detected */
}
4.2 Exception Handler
An alternative way of getting a CONTEXT structure including debug registers is by registering an exception handler. The first and only argument in a VEH exception handler is a pointer to a EXCEPTION_POINTERS structure. This structure contains information about the current exception, but also a pointer to a CONTEXT structure. From there, we can easily check if any of the debug registers are filled. There are multiple ways to implement this detection, the simplest one is using AddVectoredExceptionHandler and RaiseException.
1
2
3
4
5
6
7
8
9
10
11
12
13
14
15
16
17
18
19
20
21
22
23
24
25
26
27
28
29
30
31
32
33
34
35
36
37
/* Our exception handler */
long debug_veh(struct _EXCEPTION_POINTERS* ExceptionInfo)
{
	/* Only check if it is our exception */
	if (ExceptionInfo->ExceptionRecord->ExceptionCode == 0x1337)
	{
		/* Check each debug register field */
		if (ExceptionInfo->ContextRecord->Dr0 != 0 /* ... */)
		{
			/* Debug register detected */
		}

		/* Fix the divide by zero error (see below). The second argument should be stored in rcx, simply change it to 100 / 10 before continuing */
		/* ExceptionInfo->ContextRecord->Rcx = 10; */

		/* Exception is handled, we can continue normal execution */
		return EXCEPTION_CONTINUE_EXECUTION;
	}

	/* Try the next exception handler if it is not our exception */
	return EXCEPTION_CONTINUE_SEARCH;
}

[...]

/* Somewhere in an initialization function, register our exception handler */
AddVectoredExceptionHandler(1, debug_veh);

[...]

/* The detection can be triggered whenever you want by raising an exception */
RaiseException(0x1337, 0, 0, nullptr);

/* Alternatively, if the above does not work properly, simply trigger a divide by zero error.
   Make sure to change the exception code and fix the error (see above) */
volatile int b = 0;
volatile int a = 100 / b;
An attacker can bypass this detection by making their exception handler run before yours. To combat it, it is possible to hook at the earliest time an exception gets transferred to user-mode. As mentioned above, this is KiUserExceptionDispatcher which is implemented in ntdll.dll. This function can be hooked using various methods, the simplest being replacing the Wow64PrepareForException pointer to your own function. Some work needs to be done to correctly grab the 2 arguments, but this allows your exception handler to be run before any other ones.
4.3 MOV DRx instructions
This detection is only possible when executing in kernel-mode, as the used MOV instructions are not available elsewhere. By using __readdr and __writedr, it is possible to directly manipulate the contents of the debug registers. We can use these intrinsics to check if any of the debug registers are set. It is important to keep in mind that an attacker might have enabled the general detect bit in DR7. This causes a #DB exception to be generated every time a debug register is accessed. This can be used to quickly clear the registers when you try to check them.
1
2
3
4
5
/* Check each debug register field */
if (__readdr(0) != 0)
{
	/* Debug register detected */
}
4.4 Checking DR6
When a hardware breakpoint is triggered, DR6 is filled with information about the event. This can be used to make more informed decisions on the current situation. It is important to note that DR6 is not automatically cleared after the hardware breakpoint has been handled. The following paragraph from the Intel SDM describes this in more detail.
Certain debug exceptions may clear bits 0-3. The remaining contents of the DR6 register are never cleared by the processor. To avoid confusion in identifying debug exceptions, debug handlers should clear the register (except bit 16, which they should set) before returning to the interrupted task.
If you are sure a program does not use hardware breakpoints, it is possible to check the value of DR6 using any of the previously mentioned techniques as the attacker might have not cleared the register.
4.5 Using All Debug Registers
One of the most straight-forward techniques is simply using all the available debug registers for yourself. This technique is only limited by your creativity and allows you to both detect or crash when hardware are being used. A simple implementation of this technique is to put all the hardware breakpoints on important functions. Once the breakpoint has been called, you manipulate some data before returning to the original function. If an attacker overwrites any of the debug registers, the data manipulation will not happen and the program will crash. The example below changes the assembly and restores it right before execution. This can be repeated for all 4 debug registers so the removing one will cause the program to crash.
1
2
3
4
5
6
7
8
9
10
11
12
13
14
15
16
17
18
19
20
21
22
23
24
25
26
27
28
29
30
31
32
33
34
35
36
37
38
39
40
41
42
43
44
45
46
47
48
49
50
51
52
/* Change page permissions to RWX so we can change the assembly */
DWORD old_protect = 0;
BOOL result = VirtualProtect((void*)test_func, 0x1000, PAGE_EXECUTE_READWRITE, &old_protect);
if (!result)
{
	/* VirtualProtect failed, call GetLastError to find out why */
	return;
}


/* Change the assembly to some garbage */
*(byte*)test_func ^= 0x42;


/* Register our VEH */
AddVectoredExceptionHandler(1, debug_veh);


/* Set the hardware breakpoint on our function */
CONTEXT context = { 0 };
context.ContextFlags = CONTEXT_ALL;

GetThreadContext(GetCurrentThread(), &context);

context.Dr0 = (DWORD64)test_func;
context.Dr7 = 1 << 0;
context.ContextFlags = CONTEXT_DEBUG_REGISTERS;

SetThreadContext(GetCurrentThread(), &context);


[...]


long debug_veh(struct _EXCEPTION_POINTERS* ExceptionInfo)
{
	/* Check if the exception came from us */
	if (ExceptionInfo->ExceptionRecord->ExceptionCode == STATUS_SINGLE_STEP)
	{
		/* Restore the assembly before executing it so we don't crash.
		   We do not change it back to garbage here so subsequent calls will crash.
		   This can be achieved in a second hardware breakpoint. */
		*(byte*)test_func ^= 0x42;

		/* Set Resume Flag (RF) so we don't get stuck in an infinite loop */
		ExceptionInfo->ContextRecord->EFlags |= 0x10000;

		return EXCEPTION_CONTINUE_EXECUTION;
	}

	return EXCEPTION_CONTINUE_SEARCH;
}
Credits
Some people whose prior research helped me a lot, listed in no particular order.
- Derek Rynd (@daax_rynd)
- Can Bölük (@_can1357)
- Nemi (@0xNemi)
References
Intel Software Developer Manual
AMD Architecture Programmer’s Manual
Applied Reverse Engineering: Exceptions and Interrupts
Detecting debuggers by abusing a bad assumption within Windows
ByePg: Defeating Patchguard using Exception-hooking
-
8-byte size only available in long mode ↩
-
This article by Microsoft goes into more detail on how the mitigation works ↩
-
https://www.diva-portal.org/smash/get/diva2:830919/FULLTEXT01.pdf ↩